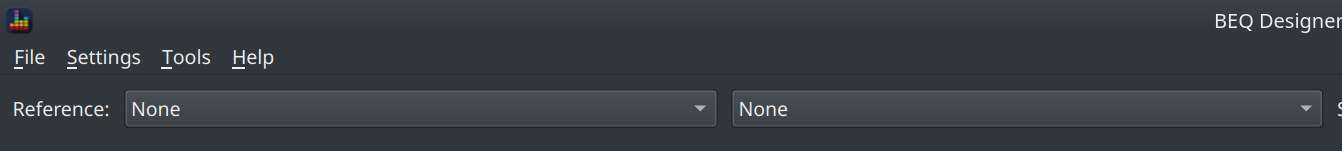
The Main Window
BEQDesigner presents the main window when it starts up.
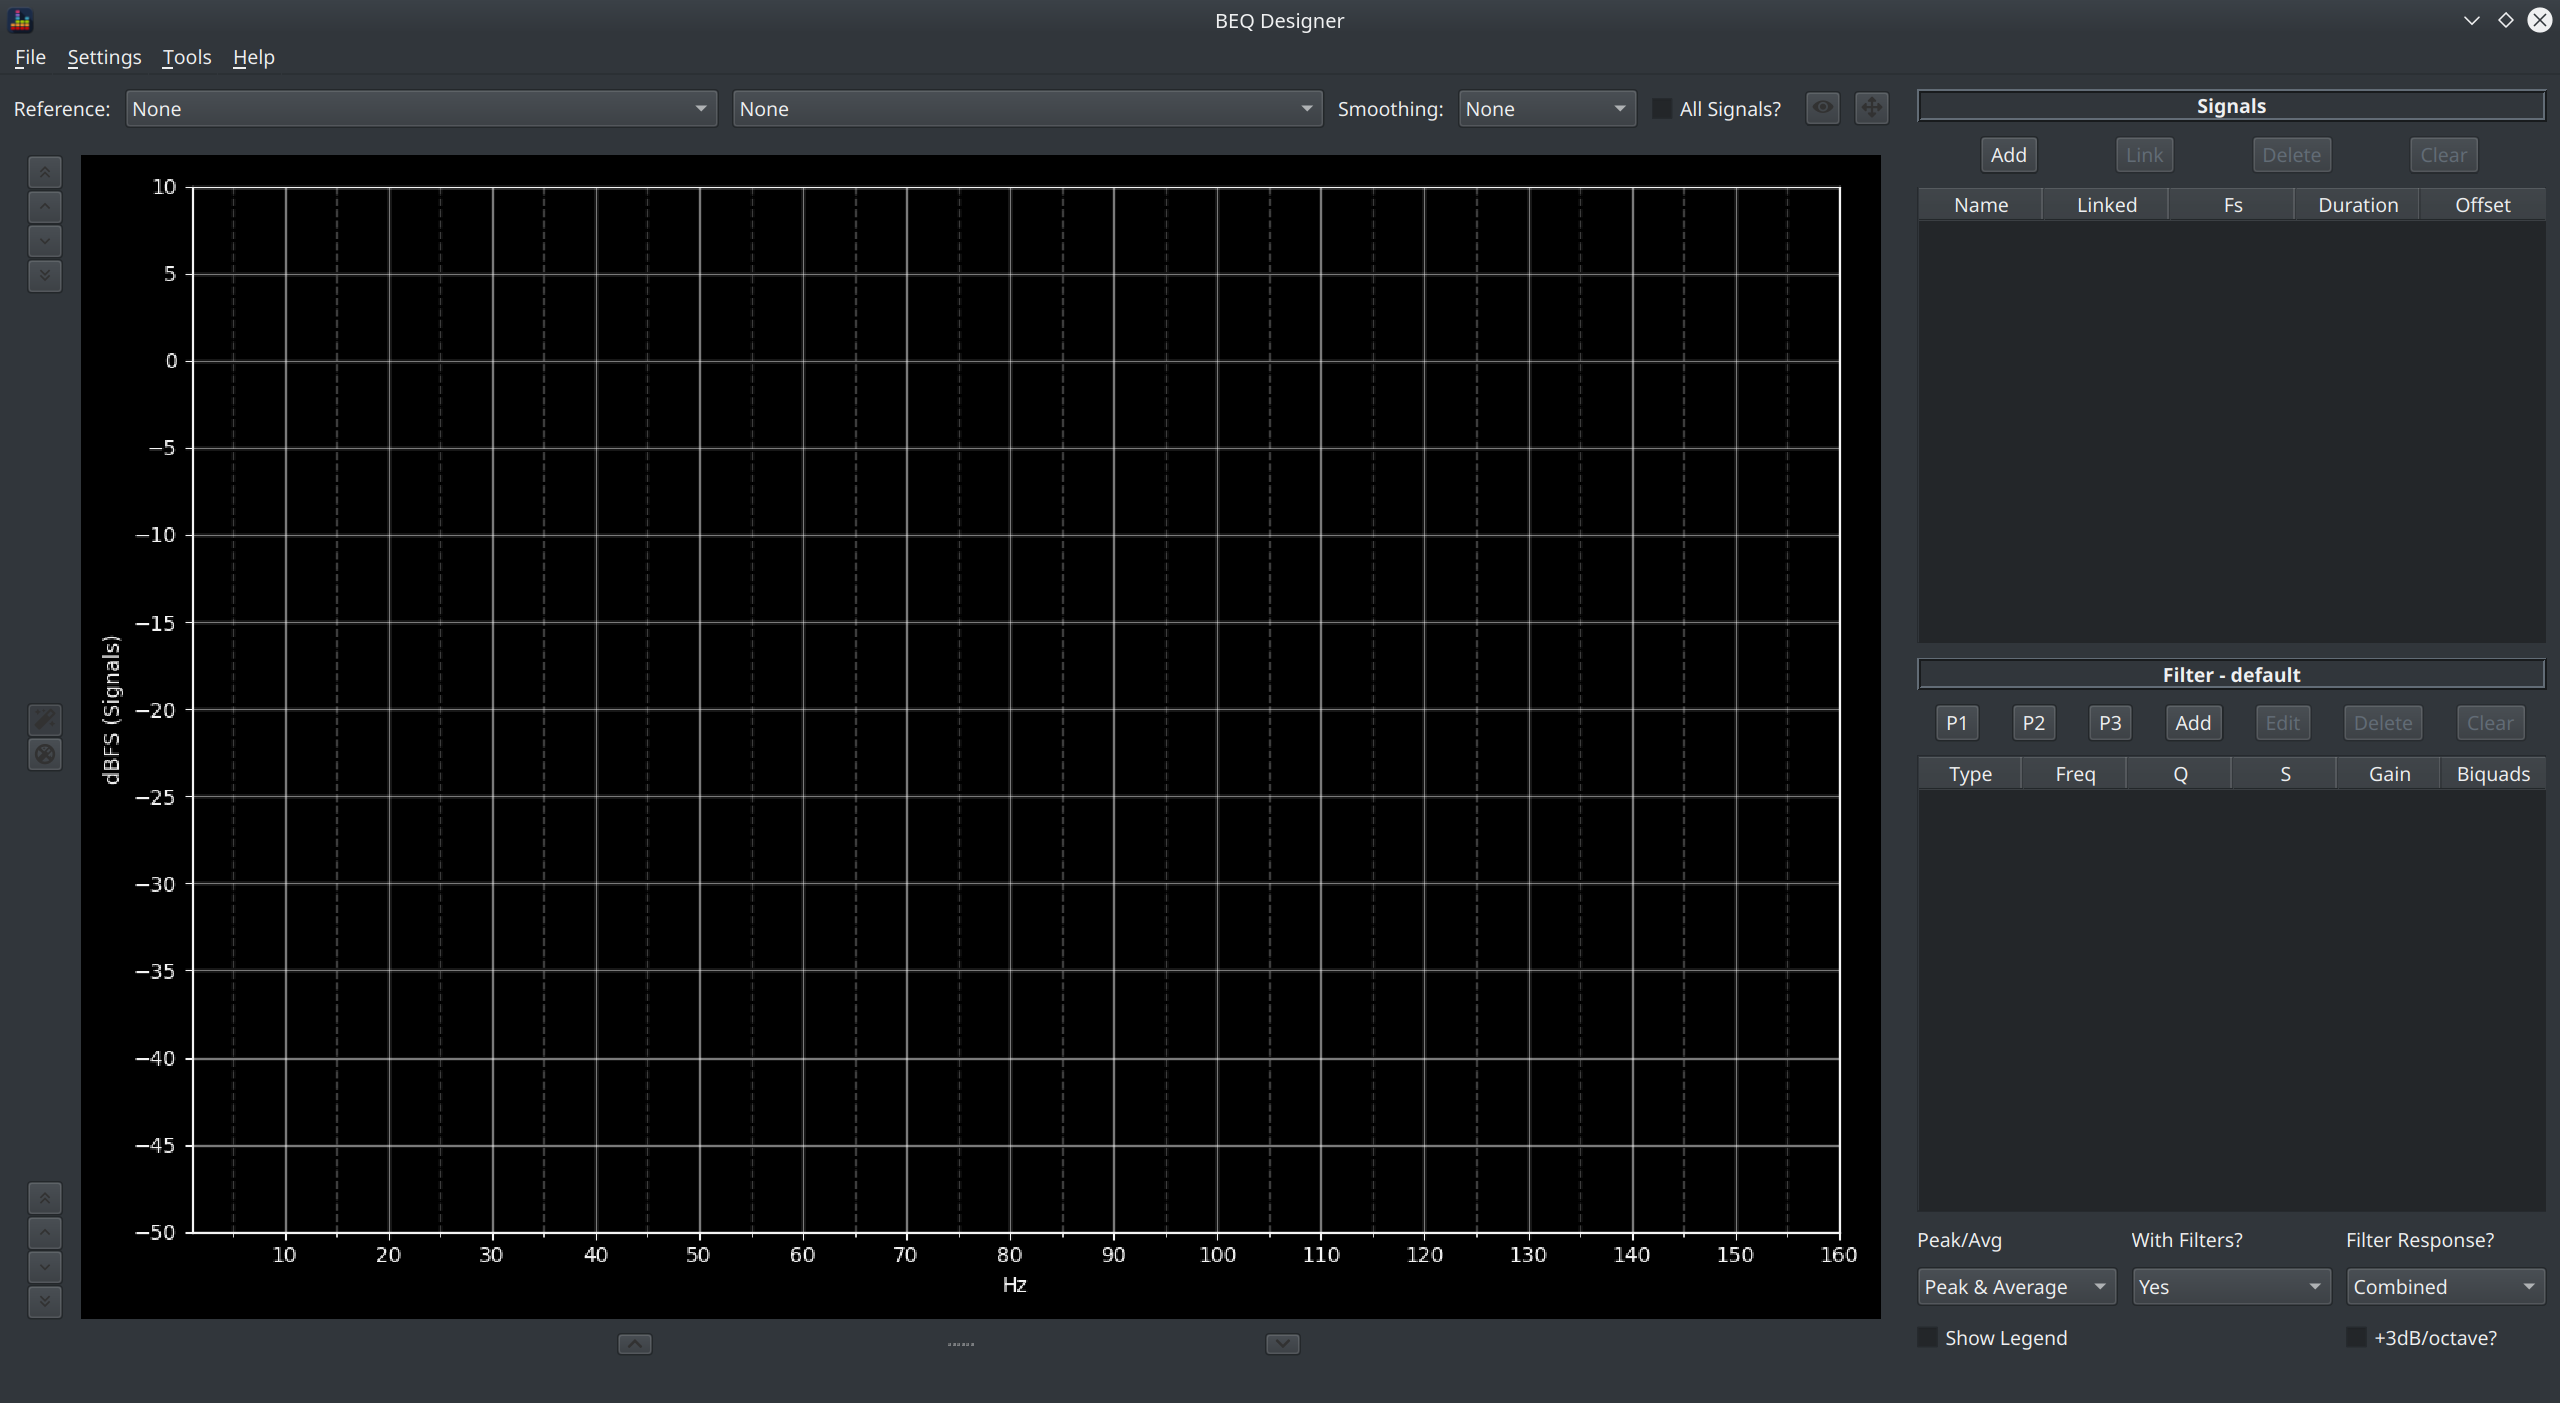
This window has two columns.
On the left is the main graph pane which is used to display the various signals and filters loaded into the application. On the right are a pair of tables with associated controls which allow you to see and control which signals and filters are loaded into the application.
Refer to Signals & Filters for an explanation of what a signal or a filter is.
Signals
Take a closer look at the signal table.
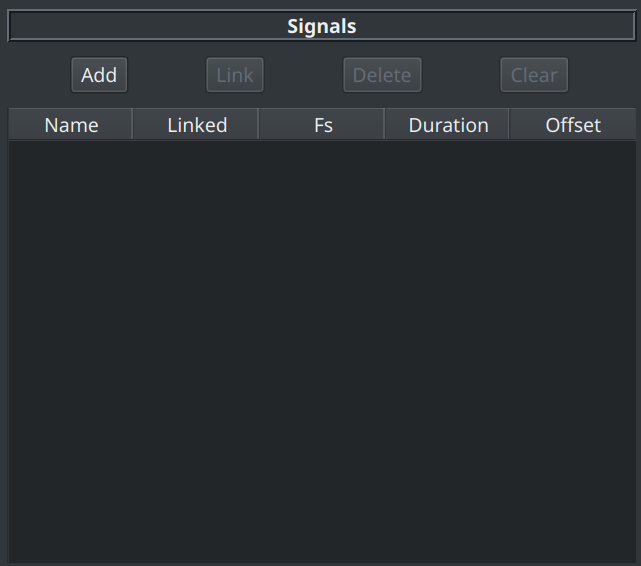
The Signal Table
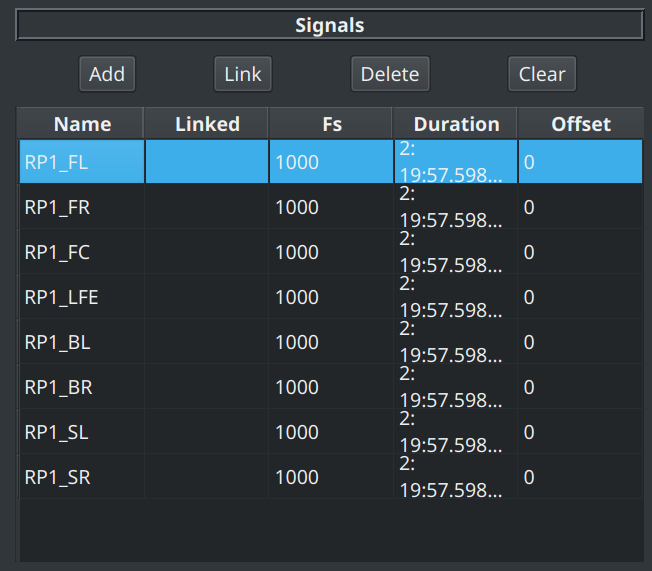
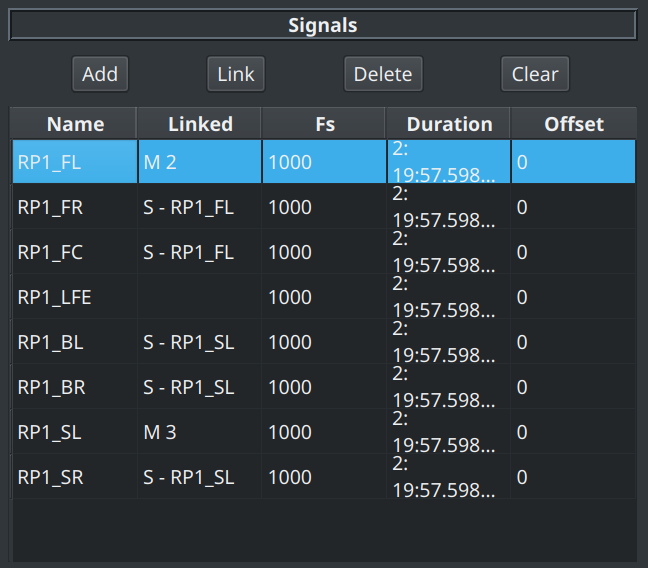
After signals have been added, the signal table shows a list of all those signals and shows:
- the signal name
- whether it is a master or slave signal
- the sample rate of the signal in Hz
- how long the signal is
- whether a volume offset (in dB) has been applied
Signal Controls
When no signals are loaded, there is just one enabled button:
- Add : clicking this button opens the Load Signal dialog which allows you to load one or more channels from an audio file into BEQDesigner
The remaining buttons are enabled after a signal has been loaded, these are:
- Link: link signals in a master-slave relationship
- Delete: remove an individual signal
- Clear: remove all signals
Linking Signals
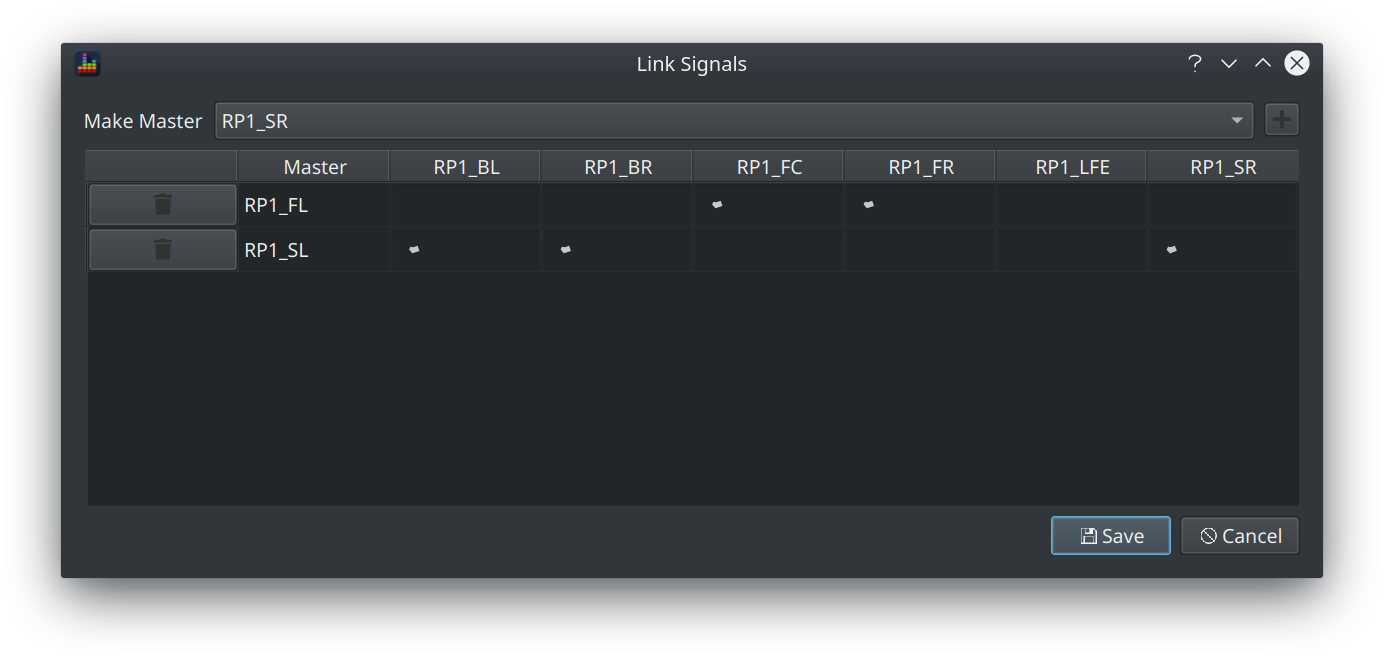
The link button opens the Link Signals dialog.
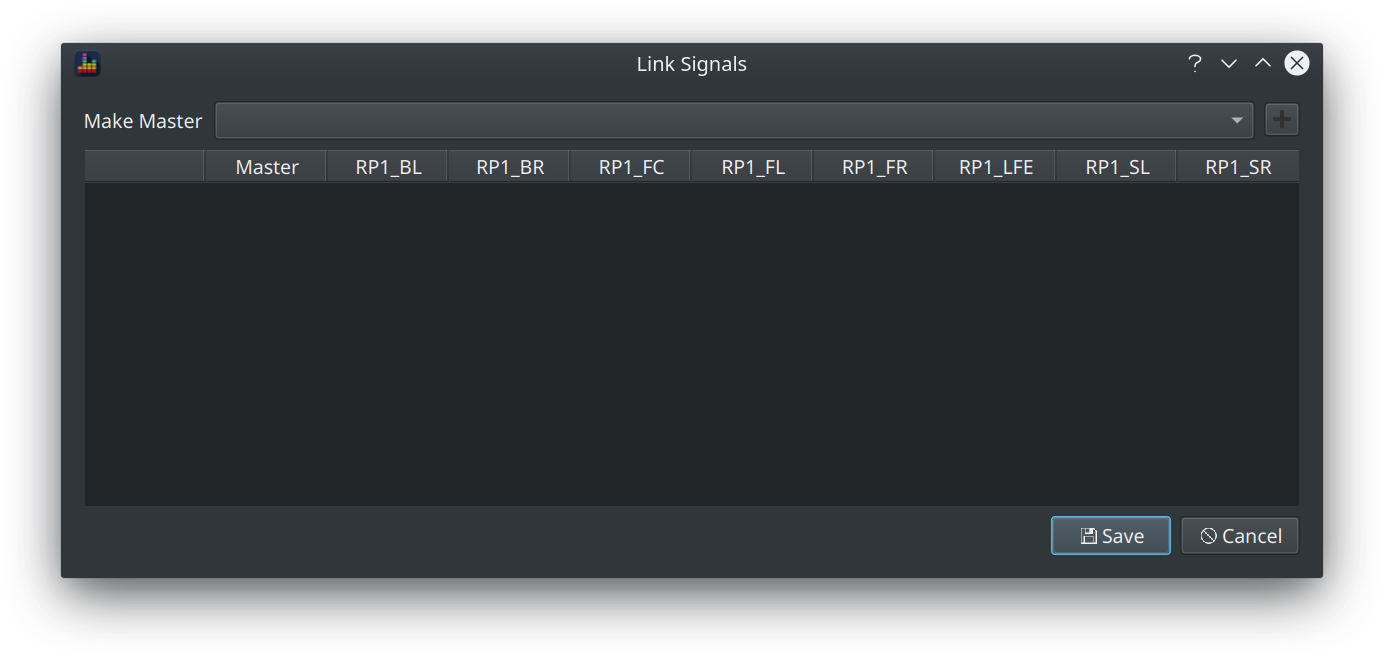
To link signals in a master-slave relationship:
- Select the master signal from the dropdown
- Click the + button
- Check the boxes for the signals you want to enslave
- Click OK
Here's an example showing a 7.1 track with the LCR and the surrounds linked into 2 groups.
After clicking OK, the signal table updates to show the relationship between the signals
Filters
Take a closer look at the filter table.
The currently selected signal is displayed in the title bar which means this table shows the filter for whichever signal has been selected in the signal table.
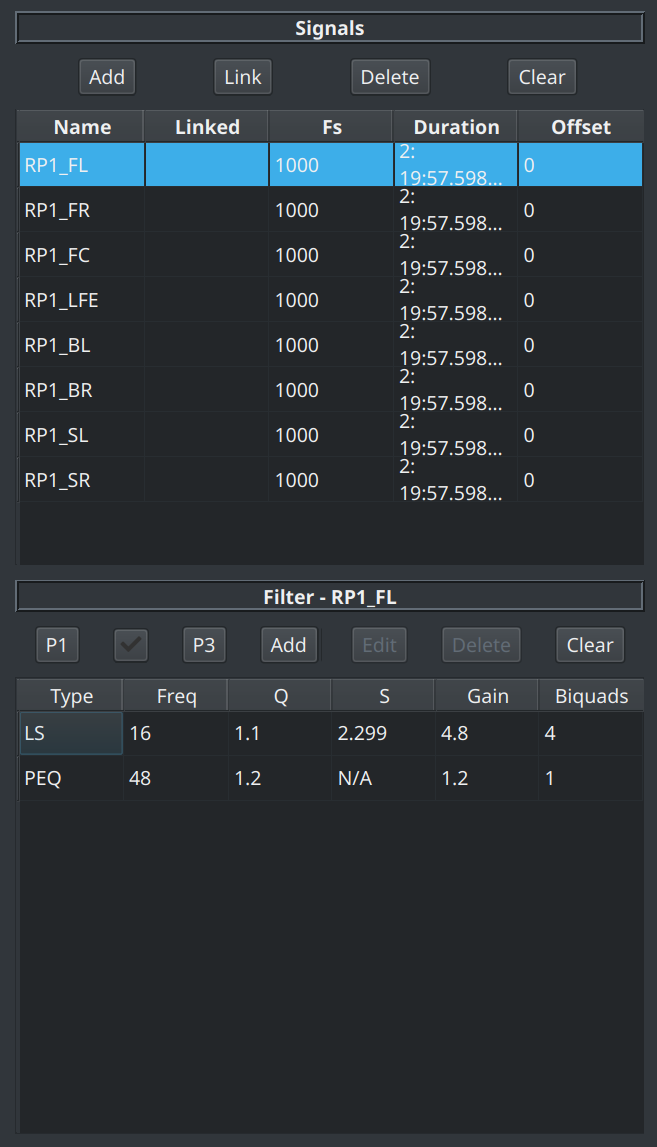
However note that filters can still be added when no signals are loaded.
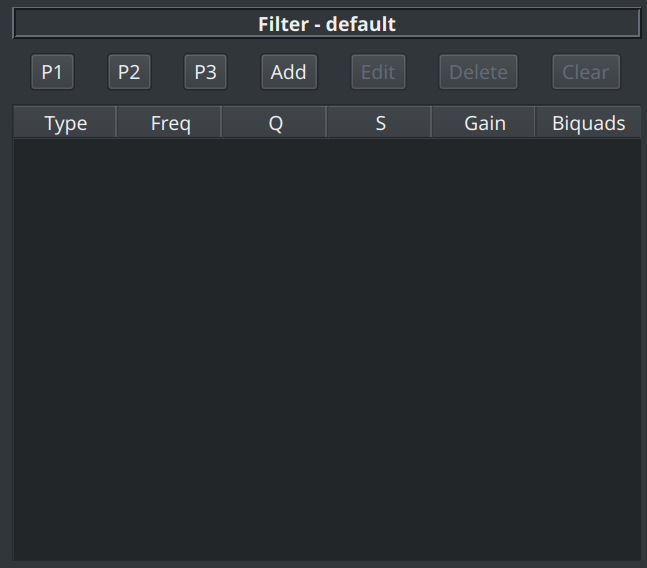
The Filter Table
The filter table contains a list of the filters added and will show the following information as appropriate:
- the filter type (e.g. low shelf, PEQ)
- the frequency (in Hz) of the filter
- the Q and S of the filter
- the filter gain (in dB)
- the number of biquads required to implement the filter
The precise data shown will vary with the type of filter, for example:
- S is only defined for a shelf filter
- gain is not applicable to a low or high pass filter
Filters are automatically sorted as they are added into ascending frequency order.
Double clicking a row will open the Edit Filter dialog for that filter.
Filter Controls
When no filters have been added, there are 4 separate buttons enabled. These are:
- P1, P2 and P3: clicking any one of these buttons will load the specified filter preset. See Filter Presets for instructions on how to define such presets.
- Add : opens the Add Filter dialog
When 1 or more filters have been added, the remaining buttons become relevant.
The following buttons are enabled if a single filter is selected in the table:
- Edit : opens the Edit Filter dialog to allow the filter to be edited
- Delete : deletes the selected filter
Finally the Clear button removes all filters from the signal.
Main Graph
Lets take a look at the main window when a filter is loaded
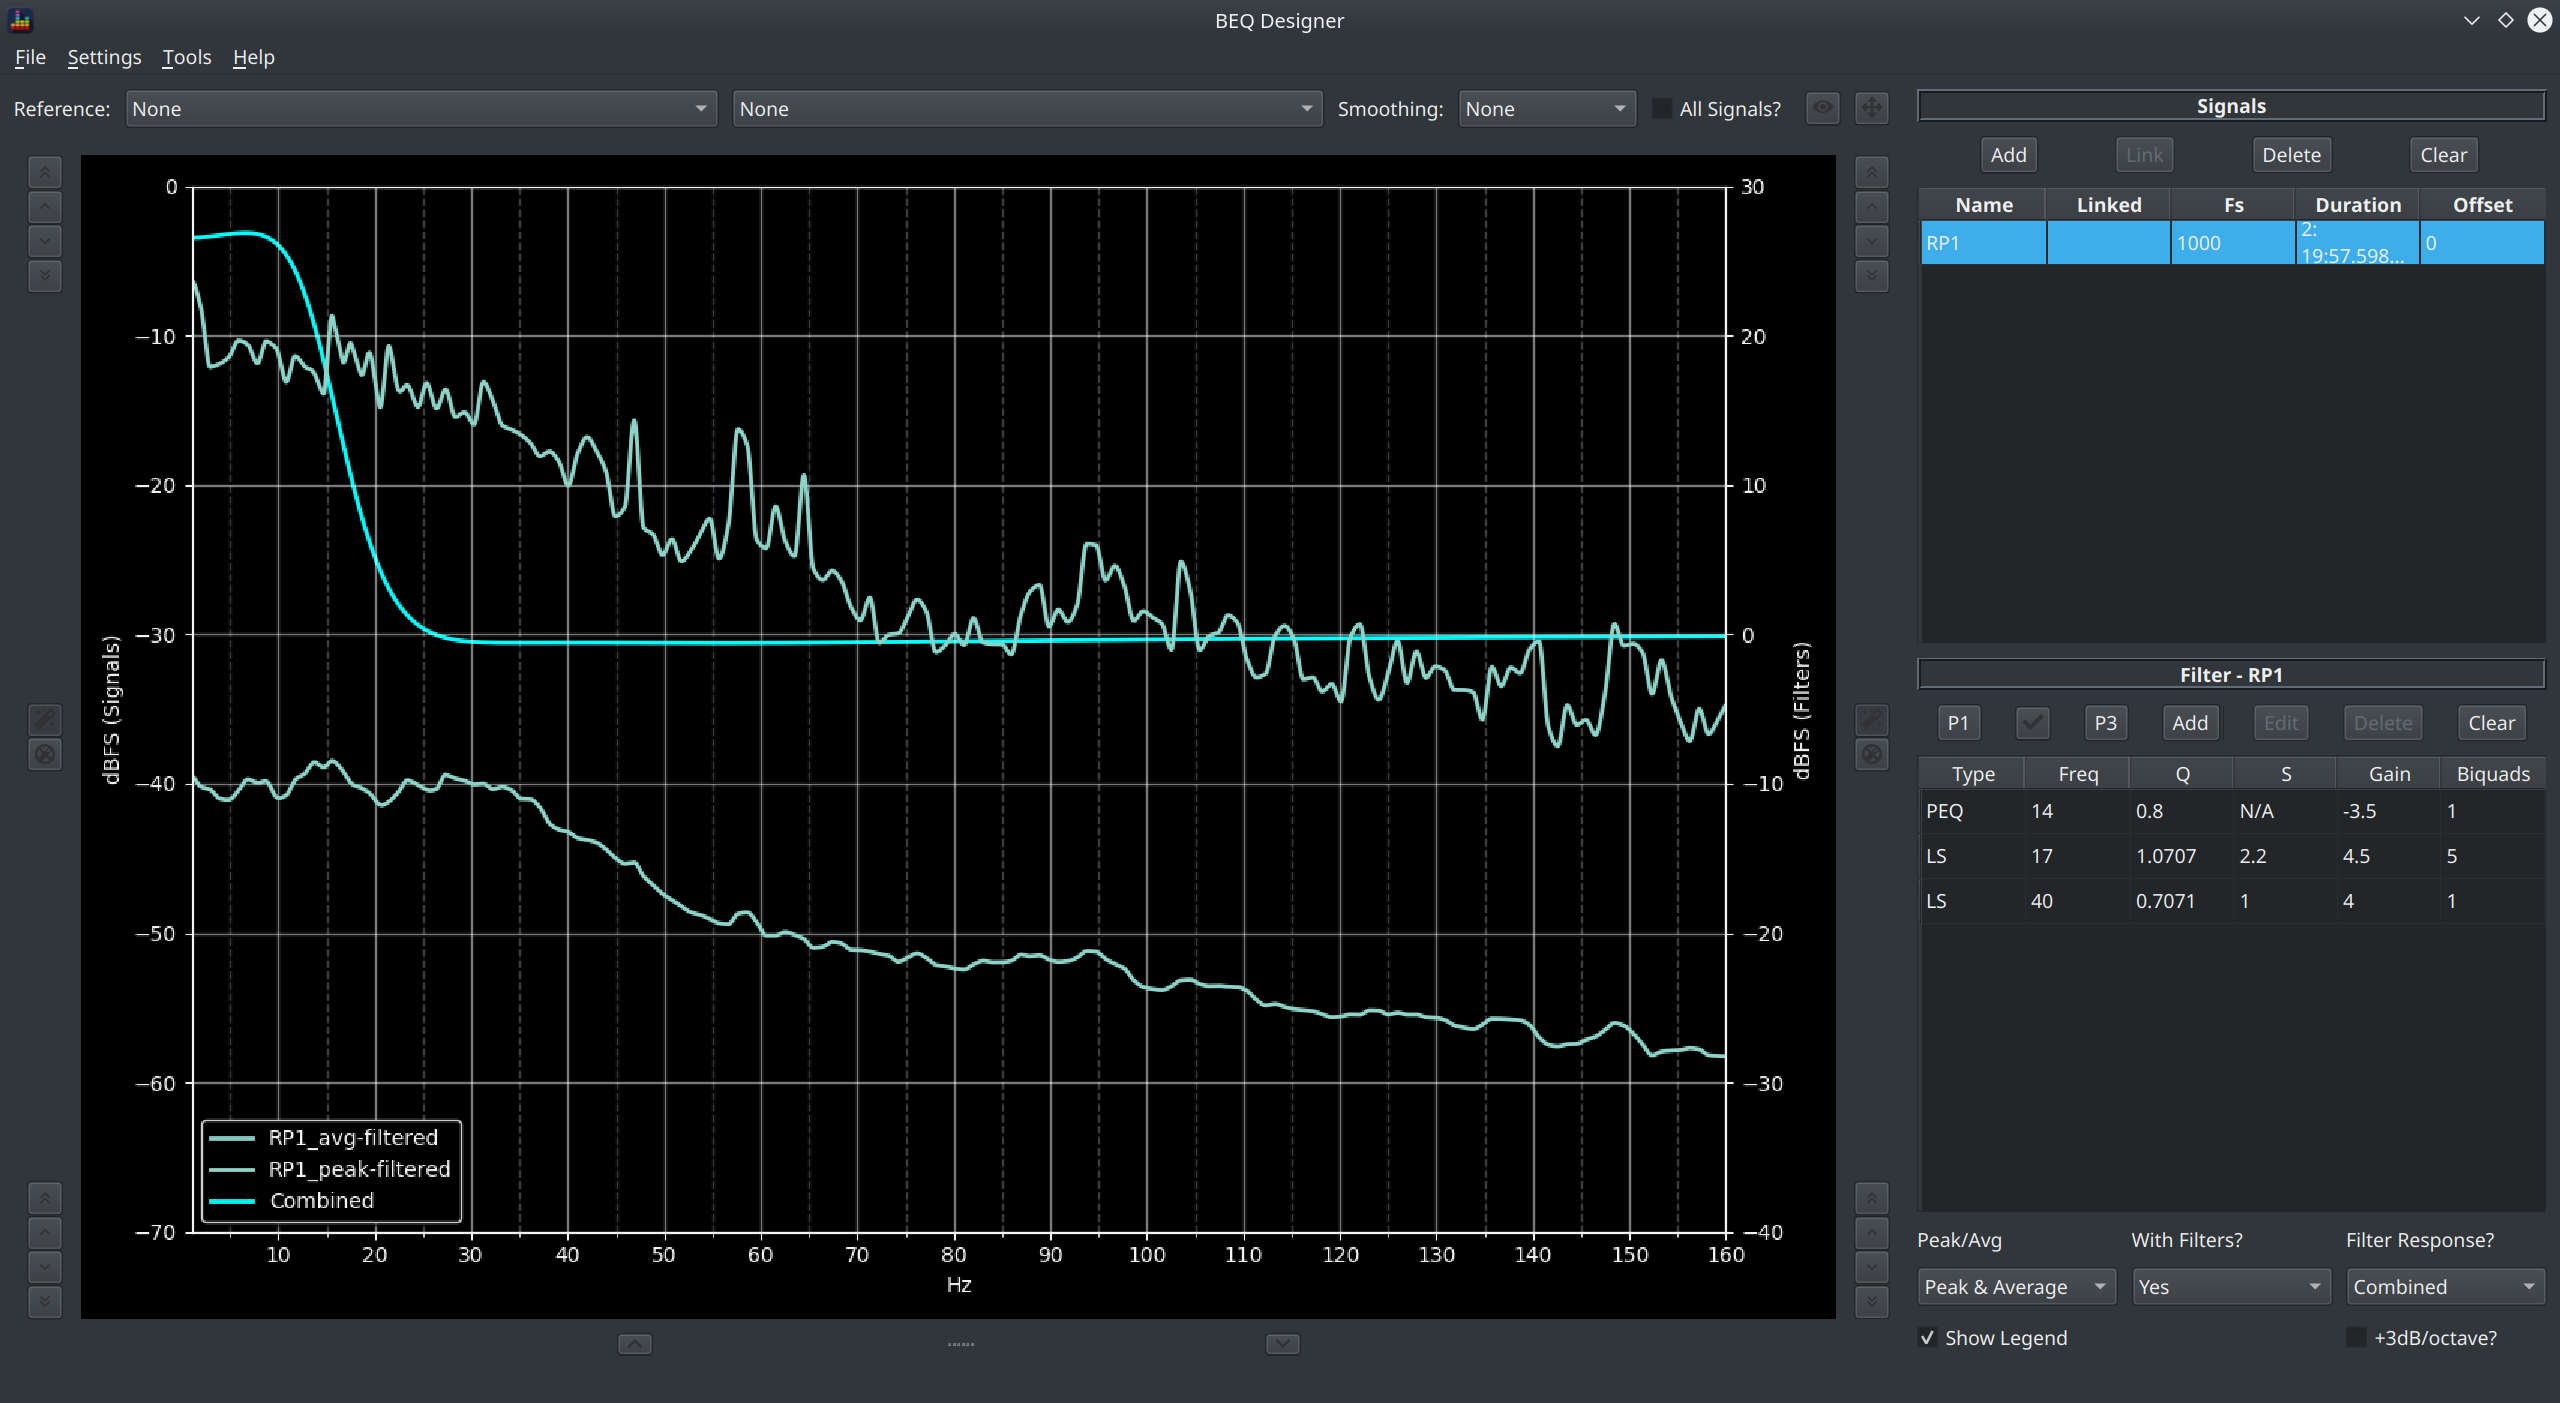
This shows the spectral content of the signal.
Main Graph Controls
The precise content shown depends on the selections made via the controls in the bottom right corner
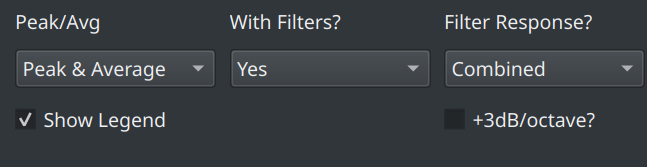
The options available are:
- Peak/Avg : show the peak response, the avg response or both
- With Filters? : show the response of the signal with or without the filters applied or show. When both are shown, the unfiltered response switches to a dashed line.
- Filter Response? : show the final filter response, the individual filters or no filters at all. Note that the filter magnitude is plotted on the secondary y axis (on the right)
- Show Legend? : shows a legend explaining which line is which
- +3dB/octave? : applies a crude 3dB/octave adjustment which approximates the difference between white noise showing as flat or pink noise showing as flat
Further options to render the responses differently or interact with the content are available above the main graph.
Managing the Y Axis Range
By default, the y axis range is automatically set to display a 60dB range with the maximum values set to ensure the peaks of the signal are visible.
This behaviour can be changed using the Auto Expand Y Limits? option in Preferences. If this value is checked then the maximum value will be set to include the visible peak and the minimum value will be set to ensure the minimum is value is also visible.
Info
Auto ranging is based on the data visible in the current x axis range only.
A quick access toolbar is also available alongside each y axis
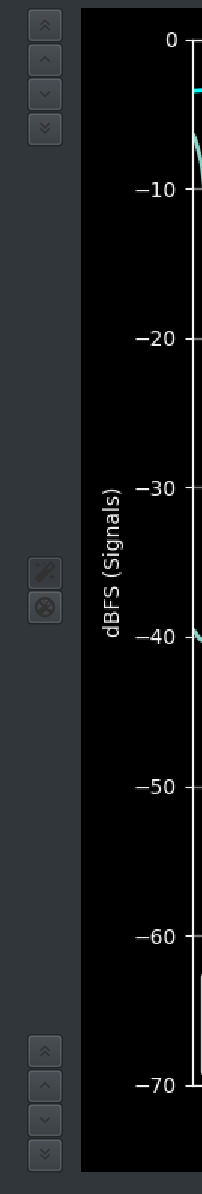
3 groups of controls are available
- Shift upper limit
- Auto ranging toggle
- Shift lower limit
Each shift group has 4 buttons which perform the following shifts in dB
- +10
- +5
- -5
- -10
The middle group acts as a toggle and either turns on or turns off the currently configured auto ranging.
Showing the difference between Curves
Two combo boxes are shown next to the Reference label
The first combo box lists the displayed signals while the second lists the filters.
Selecting either option will cause the selected curve to be shown as a straight line at 0dB, all other curves are then displayed as the difference to that reference curve.
Response Smoothing
All curves can be smoothed and various smoothing methods are available, these are
- fractional octave smoothing from 1/1 to 1/24
- Savitzky-Golay : applies a Savitsky-Golay filter to the signal
Fractional octave smoothing will change the energy levels significantly and are primarily useful for assessing perceptual balance of a full range signal. Savitsky-Golay smoothing is more useful for cutting through the noise (spikiness) in a full range signal without changing the reported energy level.
Smoothing will be applied to the currently selected signal if the All Signals checkbox is unchecked otherwise all loaded signals will be smoothed.
Warning
Subwoofer range signals do not generally require any smoothing so it is recommended to only apply smoothing to full range signals.
Magnitude by Frequency

Clicking the eye button opens the Values dialog
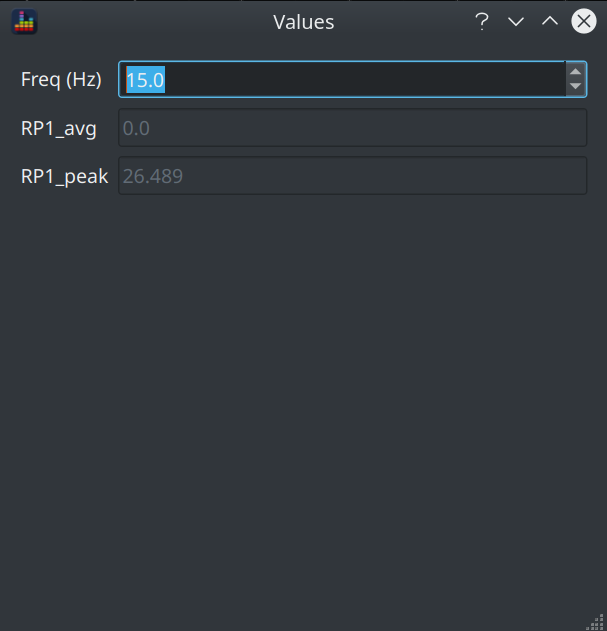
This allows you to enter a frequency and see the magnitude at that frequency for each displayed curve.
Controlling Graph Limits
Clicking the right hand button opens the Graph Limits dialog.
Graph Limits
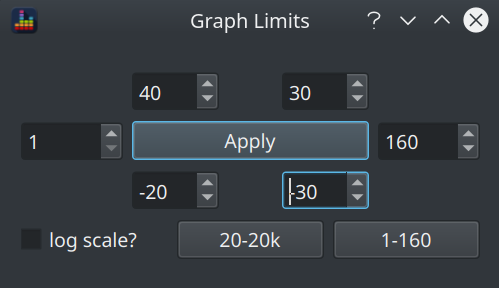
This allows control over:
- the x axis range
- the primary (signal) y axis range
- the secondary (filter) y axis range
- whether to use a linear or log frequency scale
Shortcuts to the commonly used subwoofer and full range default ranges are provided.